How Consumer Goods Importers and Distributors Can Leverage Power BI to Make Smarter Decisions
How Consumer Goods Importers and Distributors Can Leverage Power BI to Make Smarter Decisions
How Consumer Goods Importers and Distributors Can Leverage Power BI to Make Smarter Decisions
 Ken Weygand | Solutions Architect, Aptean Distribution ERP
Smart decisions start with good data.
That means not only measuring and tracking all the events at your warehouse, but using that data to guide your best practices.
With the right analytics and insights, consumer goods importers and distributors can analyze their sales performance to see where they’re performing best, improve their warehouse operations and management, and understand and address reasons why retailers take deductions and chargebacks.
Because your data is only as good as your ability to use it.
Microsoft Power BI enables consumer good importers and distributors to gain the insights and analytics they need to make smarter decisions and grow their business by implementing decisions based on data visualizations. When Power BI is integrated with an industry-specific enterprise resource planning (ERP) solution, like Aptean's, your ability to monitor and track operations within your warehouse becomes limitless.
Think about it: an ERP is designed to unify all of your systems into a single source of truth. Not only does this support efficient operations and effective organization, but it collects and centralizes that data. Your next course of action is how to interpret those data points and turn them into actionable items.
The real benefit of Power BI is that it enables you to dig into all the data you collect in different ways. In addition to creating visuals and models based on the information you collect, you can explore that data with endless valuable possibilities. From a high-level overview to a drilled-down dive into the details, you have the opportunity for better analysis simply because the data is more interactive and easier to interrogate.
For consumer goods businesses, having the capabilities of Power BI within your Aptean Distribution ERP can offer significant benefits and analysis for:
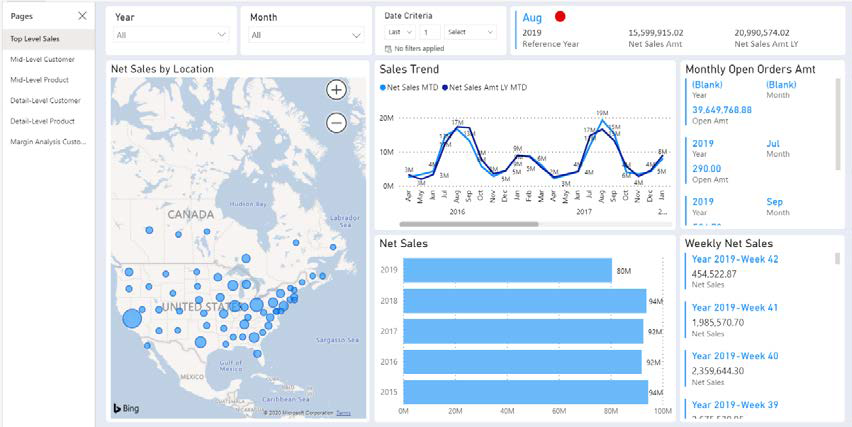
Order/sales information - The Sales and Orders Report visualization includes performance based on the sales history and orders from a company-wide perspective to the detailed level of a customer and a product. The data is gathered from the invoice lines and order lines. You can use this report to analyze whether your sales are increasing or declining. Sales analysis report visualizations allow you to dig deeper and find out why your sales are declining, which products or customers are affected, and so on, so you can take corrective actions.
Retailer compliance such as on-time, in-full (OTIF) - The OTIF Report visualization includes data related to on-time (OT) and in-full (IF) deliveries, which is a measurement of logistics or delivery performance within a supply chain. The OTIF Report visualization lets you view the performance of on-time and in-full deliveries from the business level as a whole to the focused level of either on-time or in-full deliveries for the selected duration. Analyzing your OTIF score can help you identify the root cause of late deliveries and short shipments so that OTIF scores can be improved in the future.
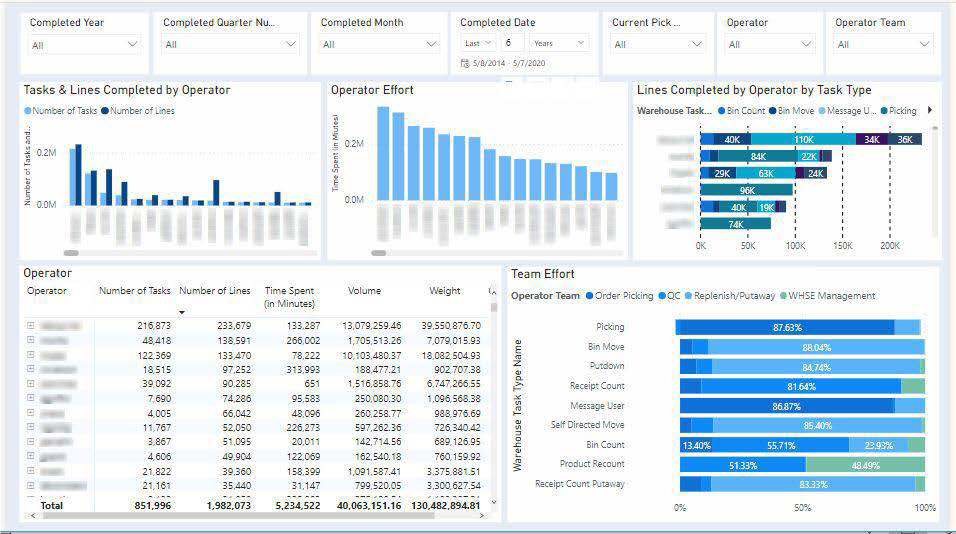
Warehouse operations and management – The Warehouse Management Report focuses on the following main aspects:
Warehouse Performance Analysis - Compare the performance of various warehouses along with key performance indicators like picking accuracy, shipping (from the warehouse) accuracy, lines per hour (LPH), and percent on-time shipments.
Picking Analysis - Involves the analysis of products based on the number of picks completed. It also includes analysis of products that tend to be picked together for grouping of products during picking. Picking reports can significantly improve warehouse efficiency and help with reorganizing the layout of your warehouse.
Warehouse Management Report – Allows you to analyze the operator's activity for the selected task and period, product movement in the warehouse, shipping details based on product and customer, warehouse task groups and data for various warehouse tasks.
Accounting and chargeback analysis - The Chargebacks Report visualization includes data related to chargebacks such as aging chargeback data and chargeback-related losses. The BI visuals let you analyze and display your company's chargeback data, which helps you monitor the chargebacks, for example, aging chargebacks and chargebacks nearing their expiration dates. This report also allows you to analyze credit and transfer data, chargeback-related losses, as well as recovered amounts. The data warehouse and Power BI are continually evolving to produce industry-focused reports to provide even more valuable analytics tools for further in-depth visibility of your business. Stay tuned for incoming features and tools.

As Microsoft says, Power BI is there to "bridge the gap between data and decision making." If you'd like to talk further about how you can leverage Microsoft Power BI functionality within your ERP, reach out to Aptean today. We'd love to talk.

Sind Sie bereit, Ihr Unternehmen grundlegend zu verändern?
Wir bieten Ihnen die spezialisierten ERP-Lösungen, die Sie für die Herausforderungen Ihrer Branche benötigen.