Featured in this post
Unlocking the Five Food Manufacturing Metrics That Matter Most
Unlocking the Five Food Manufacturing Metrics That Matter Most
Apr 16, 2024
Aptean Staff Writer
For the production manager of a food business, efficiency is everything. Taking your eye off the ball is not an option. And halting production in the middle of a run is your worst nightmare.
That’s why better data makes such a big difference. It provides easy access to key performance indicators (KPIs) to track what's happening in your business.
The result? Insights into avoidable problems—and the best chance to meet and exceed your targets.
Read on in this blog and learn how to:
Transform your production performance with the right metrics
Assess the top KPIs according to industry experts
Visualize these metrics for simplicity and success
Identify additional production metrics to optimize your business
We’ve chosen the top five metrics for food manufacturing as a general guide and starting point. Your company is unique, so we’ll help you choose the right metrics for your business.
You'll also see how food ERP solutions with built-in analytics offer many advantages over stand-alone business intelligence (BI) solutions.

Why You Need Better Data—The Power of Metrics for Food Manufacturing
Bottom line, to improve operational performance you need better data. Better data = better performance.
Accurate, real-time and digestible data helps you:
Get product out the door as efficiently as possible;
Gain insights into scheduling, waste, resource control, inventory levels, machine output and quality assurance (QA) issues that save you time;
Uncover better reporting for cross-functional teams and senior management;
Open up time for other needs.
Moreover, better data helps consolidate how performance is measured. When you have multiple production operations managers with varying levels of experience, the knowledge, information and data in your organization can become fragmented.
Tracking the right KPIs in food manufacturing also helps you get better insight into operational issues than aggregated financial data of dollars earned or lost can provide. Improved data gives you access to updated production performance indicators—and a better chance of optimizing efficiency. Simply put, you can see where the problems are. Data points like yield, scrap, and consumption provide insights that help you plan ahead and make the right decisions—before problems occur.
Once you have better data, you can isolate and monitor the metrics that translate to inventory, opportunity, waste and revenue. It puts the whole production operations team in a better position to spot patterns and improve efficiency.
Make your data work for you. You know how many variables are at play when you manage food operations. Inputs vary in type and quality from one facility to another. Economies of scale and scope affect each facility’s performance. Temperature and humidity add another level of complexity.
You can’t control all of the variables. What you can do is collect data, analyze metrics and identify key areas to focus your attention.
Let's now jump into the top five metrics for food manufacturing your operation should be measuring.
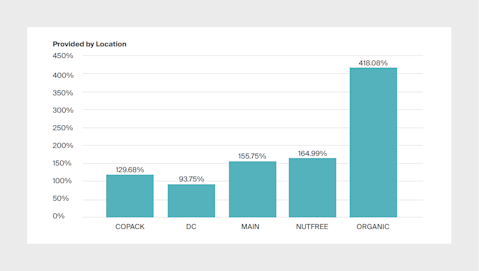
1. Yield by Location
Yield by location is a measure of how much finished product each plant produces, relative to the maximum possible production at each plant.
When you compare yield across locations, you can identify the causes of any discrepancies—likely the symptom of a problem. If one plant is more efficient than another at turning raw materials into finished product, you can examine why it’s happening. Is there a logical explanation, like different economies of scale? Or, is a plant operating sub-optimally? When you analyze it, you can address it—increasing efficiency and productivity.
How it’s visualized: Bar graph
What to look for: Differences across locations
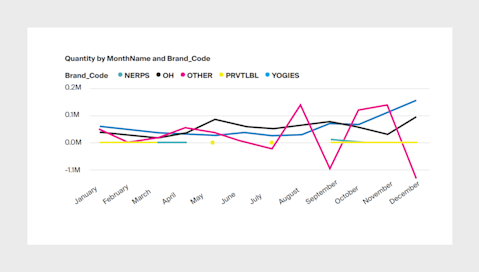
2. Quantity Produced by Time Period and Brand
This is a measure of how much inventory your company produced of each brand in a given time. You can assess performance by analyzing various units of measure (e.g., kilograms, units, cases) as well as timeframes (e.g., daily, weekly, quarterly).
Your review can reveal poorly performing products, seasonal and economic cycles, and products with inventory levels that are not well managed. Consistency is the ideal, though cyclical impacts may show up in the data. Analyzing this measure helps you focus your inventory forecasting and management efforts on areas with the greatest variation around the mean.
How it’s visualized: Line graph with filters
What to look for: Patterns, unevenness and low-production outliers
3. Expected vs. Actual Cost by Output Item
This is a measure of the difference between cost expectations and actual costs by item. It highlights systematic errors in your expectations and identifies long-term trends—like when the cost of producing an item is going up.
It’s critical to know if cost fluctuations are cutting into your margins. This metric gives the data you need to factor them into your forecasting.
4. Over/Under Consumption by Production Order (PO)
This is a measure of your actual raw material consumption by PO, compared against the expected consumption for that PO.
A PO that follows the bill of materials (BOM) exactly has a consumption percentage of 100%. Deviations above that figure indicate a problem achieving the best possible yield. Deviations below that figure suggest something else. What does that mean? Maybe economies of scale or some other factor is responsible for the unexpectedly high yield. Maybe the maximum possible yield is greater than you originally calculated if you’re regularly exceeding it.
This metric is closely related to yield, but delivers different insights that are critical to your business. Yield metrics tell you how your production operations are generally performing. Over/under consumption by production order reveals what types of transactions and POs represent the highest margins for you.
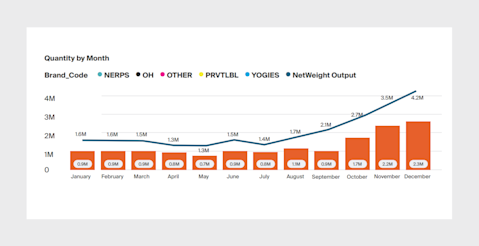
5. Quantity Produced by Month, Units vs. Net Weight
This is a measure of the number of units a facility produced, relative to the collective weight of those units. It tells you how heavy the typical unit of inventory is. This metric is useful for planning your warehouse, staffing and logistics.
Changes over time should be easy to explain. They’re usually caused by seasonal or other regular business cycles. But anything out of the ordinary deserves further investigation. Why? Because changes in this metric have a real impact on your operations and logistics—and need to be fully understood to make good forecasts.
How it’s visualized: Line and stacked bar graph with filters
What to look for: Unexpected or unexplained variation and patterns
What Are Some Other Food Manufacturing KPIs to Consider?
It’s critical to evaluate all metrics and choose your key metrics wisely—finding the data that drives YOUR food business. You don’t want to get into analysis paralysis, but you do want to pressure-test what’s right for your business. So here are a few other popular KPIs for food manufacturing companies for you to consider:
Quantity Produced by Location. Forecast future production for each facility and identify the most productive ones.
Number of Production Orders by Month. See how busy you were in a given month and where expectations were not met.
Production Order by Machine and Line. Analyze how busy your equipment is relative to its maximum utilization—and identify potential bottlenecks in the future.
Number of Production Orders and Output Quantity by Day. Uncover the causes of day-to-day variations in output.
Output Quantity by Machine Center and Year. Look at your overall asset utilization to improve asset management, maintenance and planning.
Cost by Location. Identify opportunities for cutting costs and the facilities most likely to benefit.
Leverage Metrics, Increase Efficiency
There are countless variables involved in food processing and production. And it isn’t efficient, nor feasible, to give every data point equal attention.
That’s why tracking key food manufacturing metrics is so important. It puts the right data in the right context to help you ensure success. Data-driven production operations give you a system that promotes improvement and efficiency.
These metrics for food manufacturing we covered are the starting point for a closer look at your business—and a streamlined path to success with food ERP software.
Aptean is here to support your data-driven food operations so you can cultivate your business. Interested to see how Aptean Food & Beverage ERP can help you better manage your food company? Reach out today and schedule a personalized demo.

Related Content


Get in touch today to speak with an expert in your industry
To grow your business, you need a food ERP built specifically for your industry challenges. We're ready to help—reach out today and we'll help you find the right solution.
